A few months ago, one of our own CI pipelines started failing on roughly one build in six. Same branch. Same commit. Same runner image. Nothing about the failures clustered around a single test file, and re-running the job usually made the problem disappear. That’s the worst kind of bug a build engineer can get, because it never breaks badly enough to block anyone, and it never repeats reliably enough to chase down on purpose. Two engineers spent the better part of three days tracing it back to a shared test fixture that occasionally raced against a cache-warming step, but only on a subset of runners. The eventual fix was four lines of code. Finding those four lines took three days.
That gap, between “something is wrong” and “here’s exactly what and why,” is the entire reason pipeline observability exists as its own discipline now instead of just being “check the CI dashboard.”
Monitoring tells you something broke. Observability tells you why.
Most teams already have some form of pipeline monitoring, even if nobody calls it that. Your CI platform shows pass/fail status, a queue time, maybe a duration graph. That’s useful for knowing that a build is slow or failing. It’s much less useful for knowing why, because a duration graph collapses dozens of steps, dozens of machines, and dozens of dependency states into a single number.
Pipeline observability, borrowed loosely from the same discipline that reshaped how teams debug production systems, is about being able to ask a question you didn’t anticipate ahead of time and get an answer from the data you already have. In an SRE context that means tracing a slow request across twelve microservices. In a build and CI/CD context it means tracing a slow or flaky build across compile steps, test shards, cache layers, and the specific machine each task landed on, without having to add new logging every time you think of a new question.
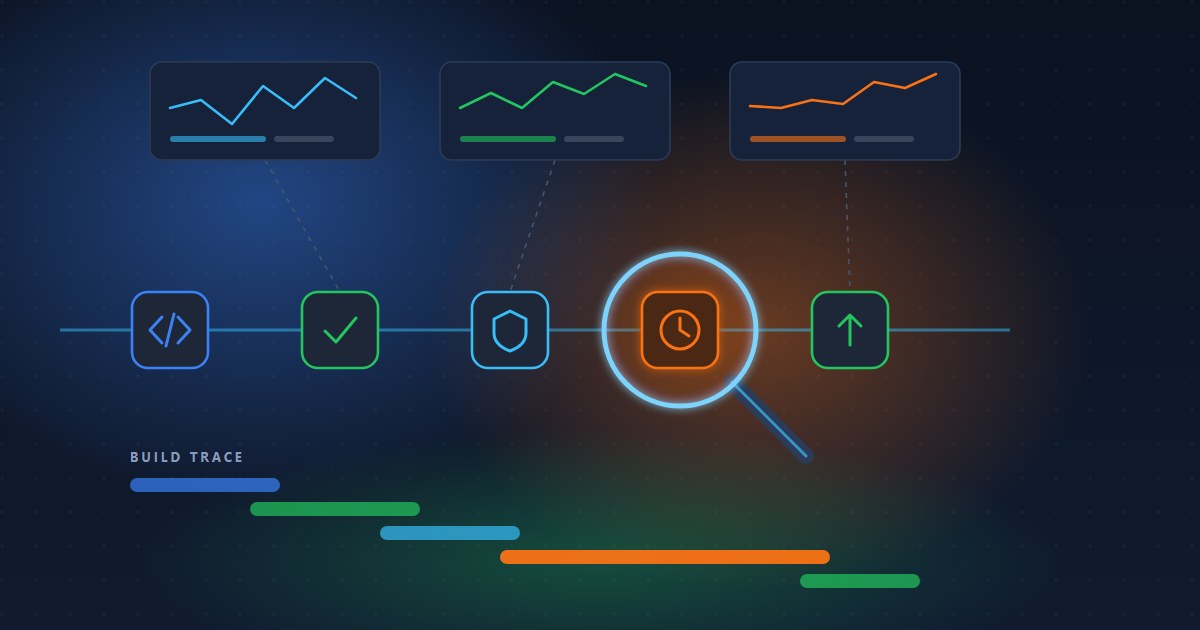
Three kinds of signal tend to show up in any real observability setup. The trend usually comes from metrics, the kind of thing that shows build duration creeping from 12 minutes to 19 over a month, or a cache hit rate sliding from 91% down to 74% right after a dependency bump. That trend alone won’t tell you which task failed, what the compiler actually printed, or which shard timed out; for that you need logs, and logs are where the specific event actually lives. What ties the two together is a trace: the exact sequence of tasks, how they depended on each other, and where the time in a single run actually accumulated. A dashboard built only from the trend line tells you something is wrong. Being able to drill from that trend into the specific trace, and from the trace into the specific log line, is what tells you what to fix. That’s the part most teams are missing, and it’s the reason a good observability setup treats these three as one connected view instead of three separate tools someone has to tab between.
Why “we have Grafana” usually isn’t the whole answer
We’d rather say this plainly than let it go unsaid: plenty of teams get real value out of general-purpose observability stacks applied to their pipelines. Prometheus and Grafana, wired up with OpenTelemetry instrumentation, can absolutely surface build duration trends and let you build custom dashboards. Datadog’s CI Visibility product does test-level and pipeline-level tracing out of the box if you’re already a Datadog shop. Buildkite’s Test Analytics is genuinely good at flaky test detection specifically. None of these are wrong choices, and for a team already invested in one of those ecosystems, bolting on pipeline visibility is often the lowest-friction path.
Where general-purpose observability tools tend to run out of road is root cause, specifically for build and compile workloads. They’re built to trace requests through services, not to understand that a shader compilation step depends on an asset cook step, that a cache miss on one machine cascades into distribution overhead on three others, or that “slow” for a build pipeline usually decomposes into a small number of causes: compute contention, cache misses, dependency graph inefficiency, or a machine that’s quietly underprovisioned compared to the rest of the fleet. Getting that level of detail out of a generic tracing setup usually means custom instrumentation your build engineers have to write and maintain themselves, on top of everything else they’re already doing.
What good pipeline observability actually shows you
The practical test of whether a team has real pipeline observability, rather than just a monitoring dashboard, is whether a new build engineer could open it during an incident and find the bottleneck without pinging whoever built the pipeline originally. A few things tend to separate the two.
Root cause visibility down to the individual task matters more than aggregate duration. Knowing a build took 22 minutes isn’t much better than not knowing anything at all. What actually helps is knowing that 14 of those 22 minutes went into a single asset-bundling step that used to take 6. That’s the difference between guessing at a fix and actually making one. Good tooling surfaces that breakdown automatically, run over run, without someone hand-building the comparison.
Cache behavior deserves its own visibility, separate from raw duration. A pipeline doesn’t only get slower because compute ran short. A cache invalidation rule can simply be too aggressive. Other times a dependency change busts more of the cache than it should, or a new build target never gets wired into the shared cache in the first place. Teams without cache-specific metrics often burn a week chasing “the CI got slower” before anyone thinks to check hit rates.
Cross-machine and cross-run correlation is what turns intermittent failures from a mystery into a pattern. Our own six-builds-in-a-row example above was invisible in aggregate metrics and obvious the moment someone could see which specific runners the failures clustered on. Flaky tests, in particular, are almost never uniformly random; they correlate with something (a runner class, a time of day, a resource contention pattern) and observability tooling should make that correlation visible rather than leaving it to be found by hand.
And increasingly, this needs to be legible to more than humans. As AI coding agents generate a larger share of commits, and increasingly kick off their own build and test runs, pipeline data needs to be queryable by something other than a person staring at a dashboard. That’s a newer requirement, and it’s part of why Model Context Protocol support has started showing up as a checklist item for build tooling roadmaps, not just a nice-to-have: an agent debugging its own failed CI run needs to be able to ask the observability layer a question directly, the same way a build engineer would.
The AI velocity gap makes this more urgent, not less
We’ve written before about what we call the AI velocity gap: coding assistants and autonomous agents can now generate code, tests, and entire pull requests far faster than most teams’ build and CI infrastructure was ever designed to absorb. Pipeline observability sits right at the center of that mismatch. When a human developer pushes three commits a day, a slow or opaque pipeline is an annoyance. When an agent is pushing dozens of small commits, each triggering its own build and test cycle, an unobserved bottleneck doesn’t just slow one person down; it becomes a compounding tax on every agent-driven workflow running through that pipeline. Teams that can’t see where their pipeline time actually goes are, in practice, capping how much agentic development their infrastructure can absorb before it becomes the bottleneck instead of the code review process.
Where this leaves you if you’re evaluating tools
If you’re building this out for a team that doesn’t have it yet, the honest starting question isn’t “which vendor,” it’s “what do we actually not know right now.” A team that can’t explain why their pipeline got 30% slower over the last quarter is dealing with a different problem than a team that already tracks duration fine but has no visibility into its flaky tests. The former needs broad root-cause tracing across the whole pipeline. Test-level analytics, which a narrower and cheaper tool might handle just as well, is closer to what the latter actually needs.
It’s also worth being honest about what observability doesn’t do. Seeing that a specific compile step is your bottleneck doesn’t shrink that compile step. Seeing that your cache hit rate has dropped doesn’t fix the cache invalidation rule that caused it. Observability is a diagnostic layer, not a performance fix, and any team that stops at “now we can see the problem” without acting on what they see has bought half a solution. This is exactly where visibility and acceleration need to work together rather than being evaluated as substitutes for each other: one tells you where the time is going, the other is what you use to claw it back.
This is the gap our own Observability product is built to close, alongside the caching and distribution engine we’re better known for. It gives teams dashboards for root-cause analysis of build-time inefficiencies, plus proactive alerts that catch a regression before it becomes a pattern. The visibility spans CI machines and developer workstations rather than treating them as separate worlds. And it includes MCP support, so an AI agent can query build state directly instead of routing every question through a human. We built it because we kept seeing the same thing in customer builds: teams who could tell us their pipeline was slow, and nothing more specific than that, right up until they had a tool that could show them exactly which task, which machine, which cache miss.
Key takeaways
Knowing your build is slow isn’t the same as knowing why. Real pipeline observability closes that gap down to the specific task, machine, or cache event responsible. General-purpose tools like Grafana, Prometheus with OpenTelemetry, or Datadog’s CI Visibility can genuinely help, especially for a team already invested in that ecosystem. Most of them, though, weren’t built to understand build-specific failure modes: cache invalidation, shader compilation dependencies, and the like. Root-cause granularity, cache-specific metrics, and cross-run correlation are what actually separate useful observability from a duration graph that just tells you something’s wrong. And as AI agents write a growing share of the commits hitting your pipeline, that visibility can’t stay something only a human reads off a dashboard; the agents need to be able to query it too.
If your team is flying blind on where pipeline time actually goes, Incredibuild’s Observability product is built to answer exactly that question. Start your free trial today.