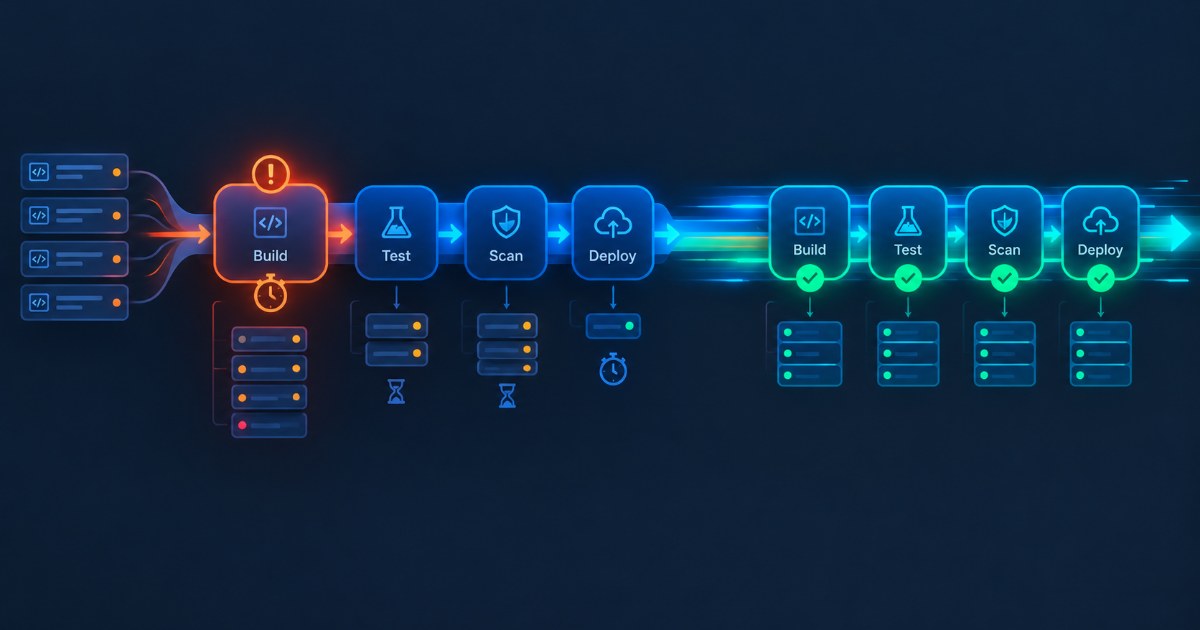
A team we work with had a GitHub Actions job that ran 34 minutes on ubuntu-latest, most of it spent recompiling C++ translation units that hadn’t changed since the previous run. That’s the pattern behind most “why is my GitHub Actions pipeline slow” questions. It’s rarely one catastrophic misconfiguration, and it’s almost always two or three ordinary things stacking on top of each other: a cold cache, an undersized runner, and a checkout step nobody’s looked at in a year.
Short answer, before the long one: you’re probably running on a standard hosted runner with less compute than your build actually needs. Your dependency and build caches likely aren’t hitting either, so every run redoes work from scratch. And there’s a good chance your jobs are structured sequentially when they could run in parallel. Below is how to tell which of those, or which combination, is yours, and what to actually do about it.
The compute you’re actually getting
This is the one people skip because it seems too basic, and it’s usually wrong. GitHub publishes different standard runner specs depending on repo visibility. Private-repo ubuntu-latest and windows-latest jobs get 2 vCPUs and 8 GB of RAM. The same labels on a public repo get 4 vCPUs and 16 GB instead (GitHub’s own runner spec reference). If your team forked a public-repo workflow, benchmarked it there, then moved the code private, you didn’t move the pipeline. You halved the CPU it runs on and kept every timing assumption from before.
Larger, paid runners go up from there:
| Runner | Rate |
|---|---|
| 2-core (standard) | $0.006/minute |
| 4-core | $0.012/minute |
| 8-core | $0.022/minute |
| 16-core | $0.042/minute |
None of that is exotic pricing information; it’s on GitHub’s own billing page. It’s easy to never check it, though, and just assume ubuntu-latest means “the runner GitHub gives everyone,” full stop. The label’s actual hardware varies by repo type, and it has scaled up over time. That gap didn’t always exist, either: GitHub moved public-repo Linux and Windows runners from 2 cores to 4 in 2025. That’s exactly why some public benchmarks in old blog posts and GitHub issues no longer match what a private repo gets today.
CPU and memory are also only half of what “compute” means here, and the other half gets missed even more often. Downloading a large cache, untarring it, and writing thousands of object files back to disk depends on disk IOPS and network throughput, not CPU cycles, and a job genuinely bottlenecked there won’t speed up on a bigger runner at all. Moving from a 2-core to an 8-core paid runner buys nothing if the underlying block storage or network interface doesn’t scale along with it. Before paying for more cores, check iostat or an equivalent tool during a real run and see whether the CPU is actually busy the whole time, or mostly waiting on disk and network.
Fix: check nproc or $env:NUMBER_OF_PROCESSORS inside an actual job run, not from memory. If a compile-heavy job is CPU-bound on a 2-core private runner, moving to a 4- or 8-core paid runner is usually the fastest single change you can make, and it’s a runs-on label change, not a re-architecture. If it isn’t CPU-bound, a bigger runner won’t be the fix; the disk and network check above will tell you that before you spend the money.
Why is my GitHub Actions pipeline slow even with caching turned on?
This one hides in plain sight, because the caching step is right there in the YAML and looks configured. It’s rarely “no cache.” More often the cache is silently missing every run. actions/cache keys on whatever hash you give it, usually a lockfile hash. If your build also depends on the compiler version, environment variables, or a config file that isn’t part of that key, the cache looks correctly configured and still misses on every single run, because the key never rotates when it should and the content underneath has actually changed.
Check the cache-hit output. That’s it, that’s the whole diagnostic step, and most teams skip it. Watch what GitHub sets on the caching step, because teams that assume caching is “working” just because the step exists rarely check whether it’s actually returning true.
There’s a second caching gap that’s specific to compiled languages. actions/cache caches artifacts you tell it about, a node_modules folder, a ~/.cargo directory, but it has no idea what a compiler actually did. It can’t tell that a specific .cpp file, with these exact flags, on this exact compiler version, produced this exact .o file, and reuse that fact automatically. That’s a fundamentally different kind of cache. It’s content-addressed, keyed on the actual inputs to a compile step, not on a lockfile you remembered to hash. It’s also the reason C/C++ and other compiled-language pipelines tend to stay slow even after actions/cache is wired up correctly for dependencies.
Underneath both of those problems sits a harder prerequisite: hermeticity. A build step that isn’t fully isolated from its host environment, one that embeds a build timestamp, reads a machine-specific path, or depends on whatever happens to already be installed on the runner, fights any caching system no matter how it’s implemented, because the same logical input produces a different actual result every time. A cache is only ever as reliable as the hermeticity of the build producing what it’s caching. This cuts both ways: loosening a cache’s matching logic to force more hits is often worse than the slow build it’s replacing, since a looser match can just as easily ship a stale binary with a bug still in it as save time.
For a codebase large enough that hashing every file on every build gets expensive in its own right, modern build systems avoid re-hashing everything from scratch by organizing inputs into a Merkle tree and only re-walking the branches that actually changed. That’s a meaningfully different engineering approach from hashing a flat list of files, and it’s part of why a purpose-built build cache tends to hold up better at scale than a general-purpose caching action bolted onto a CI workflow.
Sequential jobs that don’t need to be sequential
Workflow structure itself causes plenty of this too. Picture build, lint, unit test, and integration test wired as one long chain, each job waiting for the last, when only integration tests actually depend on the build artifact. That’s free parallelism sitting unused. GitHub Actions already supports splitting independent jobs to run in parallel, and using a matrix strategy for anything that varies only by OS or version; it just requires the workflow YAML to say so. We’ve seen teams cut wall-clock time by roughly a third just by fixing job dependencies (needs:) that were copied from an earlier, simpler workflow and never revisited as the pipeline grew.
This is Amdahl’s Law showing up in a build pipeline instead of a textbook: the pipeline’s total wall-clock time is bounded by its longest sequential critical path, not by how much of the rest gets parallelized. If integration tests dominate total pipeline time, splitting the linting job into four parallel shards does nothing for wall-clock time, because linting was never on the critical path to begin with. Find the actual critical path first, the Actions UI’s timing view makes this visible, and parallelize that, before spending effort parallelizing whatever happens to be easiest to split.
A quieter version of the same problem is job queueing, not job execution. GitHub’s own runner reference notes that GitHub-hosted runners on standard labels are kept in a “warm” pool with minimal queue time, but self-hosted runners and larger runners don’t get that guarantee. If your org is running self-hosted runners at or near capacity, a job can sit in queue for minutes before it even starts, and that queue time shows up in your total pipeline duration even though it isn’t in any step’s log. Check the gap between “workflow triggered” and “job started” in the Actions UI before assuming a slow step is the culprit; sometimes nothing is slow, the job just waited.
Repo and checkout overhead
actions/checkout defaults to a full clone unless you set fetch-depth. On a repository with years of history, that default clone can cost real minutes before your build even starts, and a CI job usually doesn’t need any of that history sitting there. It isn’t running git log or git blame. A shallow clone (fetch-depth: 1) is normally enough. Large binary assets committed to the repo, game assets, prebuilt SDKs, test fixtures, compound this every single run, since Git doesn’t dedupe them the way a build cache would. Git LFS or an external artifact store moves that weight out of the clone path entirely.
Artifact upload and download steps between jobs carry the same kind of hidden cost. Uploading a full build/ directory as an artifact, then downloading the whole thing in a downstream job, is common and usually more data than the downstream job needs. Narrowing the path on both actions/upload-artifact and actions/download-artifact to just what’s consumed next is a small change that adds up on large monorepos.
There’s a broader principle behind that fix: data locality. Every time a build crosses a network boundary between jobs, it pays a serialization and latency tax, uploading to blob storage, then pulling it back down on another machine. If a downstream job strictly depends on an upstream build’s output and nothing else forces them apart, running both steps sequentially on the same runner, instead of splitting them into separate jobs connected by an artifact, can be faster overall even though it gives up the parallelism that splitting jobs is usually supposed to buy. Splitting jobs is a real win when the jobs are genuinely independent; it’s a cost when it’s mainly moving one job’s output across a network so a second job can read it back.
Unpinned actions and marketplace overhead
This one is a mistake more than a bottleneck, but it belongs on this list because it’s invisible until it isn’t: referencing third-party actions by a moving tag (@v4) instead of a pinned commit SHA means a workflow’s behavior, and sometimes its runtime, can change under you with no diff in your own repo. It’s also a supply-chain risk independent of speed, and the same reasoning behind SBOM and build-provenance requirements under frameworks like the EU Cyber Resilience Act applies to your CI dependencies, not just your production ones. Pin to a SHA, and update deliberately rather than automatically inheriting whatever the tag points to today.
The pattern behind all of this
None of the five causes above are new, individually. What’s changed is the volume of code hitting these pipelines. GitHub’s own Octoverse 2025 report puts monthly merged pull requests at 43.2 million, up 23% year over year, and total 2025 commits at just under a billion, up 25.1%, with GitHub’s Copilot coding agent alone authoring more than a million of those pull requests in a five-month span between May and September 2025.
Part of why that specific figure matters for a build pipeline, rather than just being a general growth statistic, is behavioral. An agent doesn’t get tired and doesn’t bundle small ideas into one commit the way a person often will out of habit. It can propose a dozen small, independent changes in a single session where a human working the same problem might propose two or three, and every one of those changes is a fresh input that forces a new compile if nothing catches it first. That’s a direct, mechanical reason shared remote caching matters more now than it did before agents were writing a meaningful share of the code hitting these pipelines, not just a general observation that more code exists.
Treating each slow pipeline as an isolated incident misses the bigger picture. A pipeline that was “fine” at last year’s PR volume can become the visible bottleneck this year for no reason other than more code arriving at it, more often, from more contributors, including AI agents, than it was designed to absorb. The mismatch between how fast code gets written and how fast CI/CD infrastructure can execute it is a real, measurable trend, not just an Incredibuild talking point.
Where this is likely headed over the next year or two is still genuinely unsettled. The incremental version is more of the same: bigger hosted runners, better default caching, tighter GitHub Actions and Copilot integration. A more speculative possibility is a shift toward CI systems that skip static “runner sizes” altogether and allocate compute dynamically per job based on what a task actually needs, closer to how build acceleration tools already treat compute as a pool rather than a fixed machine. That second possibility is one plausible direction, not a settled prediction.
What doesn’t need a paid tool
Before naming what we sell, here’s what doesn’t require buying anything at all. ccache and sccache are free and handle compiler-level caching well on a single machine or a single runner. Spreading compilation across several machines you already control is possible too, with distcc, but it means installing the exact same toolchain by hand on every helper, and that’s real ongoing maintenance work, not a one-time setup cost. If the actual problem is just “not enough CPU,” GitHub’s own larger runners, described above, solve that directly without a third-party tool at all. None of these solve cross-run, cross-machine caching: the thing that lets a change one developer already built somewhere in your org get reused instead of rebuilt on every single CI run and every teammate’s laptop. For a small team on a single repo, though, they’re often genuinely enough, and it’s honest to say so.
Where Incredibuild fits, if you’ve ruled out the above
If you’ve checked runner size, fixed your cache keys, parallelized independent jobs, shallow-cloned, and you’re still watching a 30-minute build because the underlying compile-and-link work is just that large across a big C++, C#, or mixed-language codebase, that’s the point where shared caching and distributed processing start to matter more than any single workflow tweak. Incredibuild’s cache identifies task inputs (the exact command, environment variables, compiler version, and source content) through process instrumentation, and reuses a result if it’s already been computed anywhere in your org, not just in your local actions/cache scope. When there’s no cache hit, distributed processing spreads the remaining work across idle compute you already have, on-prem or cloud, without requiring the toolchain to be pre-installed on every helper machine the way distcc does. Setup is an agent install and a runs-on change, not a rewrite of your build scripts.
A remote cache only pays off when the time to fetch a cached result over the network and write it to disk is less than the time it would take to just recompile locally; it isn’t a policy of caching everything regardless of size. For a massive C++ translation unit, fetching a cached object file is almost always the clear win. For a single tiny .c file, the network round-trip can genuinely be slower than just compiling it again on the spot. Making that comparison per task, rather than fetching indiscriminately, is what actually separates a well-built caching layer from one that just happens to have a network attached to it.
Incredibuild’s own Build Runners are managed CI runners with that caching built in natively, purpose-built for CI workloads and running roughly four to eight times faster than standard hosted runners on comparable workloads. They’re currently in Early Access, free for three months, and require an application rather than being instantly available (see the Build Runner EAP page). That EAP status matters and shouldn’t get glossed over: it’s not yet a drop-in, always-on product the way Build Cache and Distributed Processing are.
There’s also a real case where this isn’t the right fix at all. If your pipeline’s slowness is dominated by flaky, retried tests or network-bound integration steps rather than compute-bound compilation, no amount of caching or distribution helps. That’s a test-reliability problem, and it needs to be solved as one. And if your actual CI spend and wait time are both small, a handful of short-running Python or JS jobs, nothing compile-heavy, the free fixes above will likely get you further than any acceleration layer, paid or open-source.
On cost specifically: a team paying per-minute for progressively larger GitHub-hosted runners is optimizing the wrong side of the ledger if the underlying problem is redundant work, not insufficient cores. A bigger runner makes a wasteful build finish faster; it doesn’t stop the waste. Shared caching removes the redundant work itself, which is usually the cheaper fix at scale, though it requires more upfront setup than clicking a bigger runner size in a dropdown.
Quick self-check
| Symptom | Likely cause | Where to look |
|---|---|---|
| Build is CPU-bound the whole run | Undersized runner for a private repo | nproc inside the job; compare to the 2-vCPU private-repo default |
| Disk or network stays busy while CPU sits idle | I/O or network throughput is the actual bottleneck, not CPU | iostat or an equivalent tool during a real run |
| Cache step runs but timing never improves | Cache key doesn’t match what actually changed | The cache-hit output on the caching step |
| Long gap before a job’s first log line | Runner queueing, not slow execution | Time between “triggered” and “job started” in the Actions UI |
| Checkout step takes minutes by itself | Full-history clone or large committed binaries | fetch-depth setting; repo size via git count-objects |
| Timing changes with no code diff | Unpinned action tag moved | Action references using @v4 instead of a pinned SHA |
Key takeaways
Most slow GitHub Actions pipelines aren’t broken, they’re under-diagnosed: a 2-core runner assumption left over from a public-repo benchmark, a cache key that quietly stopped matching, jobs that run in sequence out of habit rather than necessity. Work through runner size, I/O and network, cache-hit rate, job parallelism (starting with the actual critical path, not whatever’s easiest to split), checkout scope, and action pinning in that order before reaching for anything paid. GitHub’s own larger runners and free tools like ccache, sccache, and distcc solve a real share of this for free. When the remaining bottleneck is genuinely compute-bound compilation at scale, and the physics of fetch-versus-recompile actually favor a remote cache, shared caching and distributed processing, ours or otherwise, is the next lever. Starting a free trial is a reasonable way to see which category your pipeline actually falls into before committing budget either way.