
Debugging is clearly an important skill for any programmer in any language, with C++ probably requiring better debugging skills than most popular languages, due to its relative complexity. What’s more, the actual problems we solve with C++ tend to be more complex, which may bring about unexpected results that require analysis and debugging.
Programs tend to have bugs, and C++ possibly even more so than most other languages. Troubleshooting issues like crashes, memory corruption, leaks, dangling pointers and others is a required skill for any C++ programmer. C++ best practices should be used to avoid bugs, but in this post we will work under the assumption that even the best programmer will occasionally encounter them. This makes the ability to debug a C++ program crucial, and that’s what this post is all about.
You may be experienced with IDEs that provide a graphical interface for C++ debugging. Behind the scenes, your favorite IDE runs a debugger such as LLVM, GDB, WinDbg, etc., on either your local machine or a remote one, wrapping it up nicely with user-friendly graphics. In many cases, it would be more time-efficient to investigate a crash using the command-line only – it requires learning syntax, but offers a lot of flexibility and customizability. Some cases require terminal debugging, for instance when debugging code in environments such as production, which does not have IDEs or allows remote access for this purpose.
This post provides a step-by-step demonstration intended to teach just enough to allow any programmer to debug code on the terminal alone, and to do so with more ease than you may have thought possible. Even if you are experienced with debugging via the command-line, this guide will hopefully present a few helpful tricks. We will also learn how to open a core dump or crash dump to view where the program crashed. Take your bare-hand programming skills up a notch by learning how to debug in the terminal.
We are going to cover in this post:
Debugging in TUI Mode
Stepping into a function
Restarting the program
Setting breakpoints and watchpoints
Clearing breakpoints
Cleaning program prints
Seeing our program crash
Debugging multiple threads
Printing a variable
Printing the stack pointer and its content
Viewing the Assembly
Viewing the registers
Core dumps
Let’s start
Consider the following code:
#include <iostream>
#include <thread>
#include <vector>

void DoSomethingBad() {
    while (true)
        std::cout << 1 / (rand() % 12) << std::endl;
}

int main() {
    unsigned int num_threads = std::thread::hardware_concurrency()
    std::vector<std::thread> threads;
    std::cout << "Running with " << num_threads << " threads." << std::endl;
    for (int i = 0; i < num_threads; ++i)
        threads.push_back(std::thread(DoSomethingBad));
    for (auto && th : threads)
        th.join();
    return 0;
}
You can play with the code yourself on Coliru.
It is easy to see that there is a problematic line, that in some probability will be attempting to divide by 0 at line 7.
We are about to use GDB to debug our little C++ program, which is the GNU Project Debugger.
g++ problematic.cpp -pthread -g -o problematicWe added the flag -g, which is required to make GCC produce debug information. This would allow GDB to debug our code. Note that for GDB debugging there is a better choice, -ggdb, which in some cases produces more expressive debugging when using GDB, and should be at least as good as the -g option.
If you are debugging an optimized code, which is of course usually the way to go, consider using -Og for the standard edit-compile-debug cycle, as recommended by GCC (for GCC optimization options see: https://gcc.gnu.org/onlinedocs/gcc/Optimize-Options.html#Optimize-Options).
Note that we need the -pthread flag for POSIX thread support.
Now that we have debugging information in our produced executable, we are ready to launch GDB.
So we simply run:
user@mylinux:~/debugging$ gdb problematicAnd we get:
user@mylinux:~/debugging$ gdb problematic
GNU gdb (Ubuntu 9.2-0ubuntu1~20.04) 9.2
<...GDB Copyright Notes …>
For help, type "help".
<...>
Reading symbols from problematic...
(gdb)
GDB had opened a debugging session for us to debug our program. Now before we start our debugging session, it is ok to know ? that there is an official GDB song, first published in 1988: https://www.gnu.org/music/gdb-song.en.html. We will get back to some of the options mentioned in the song, but you may want to take a break to learn the lyrics.
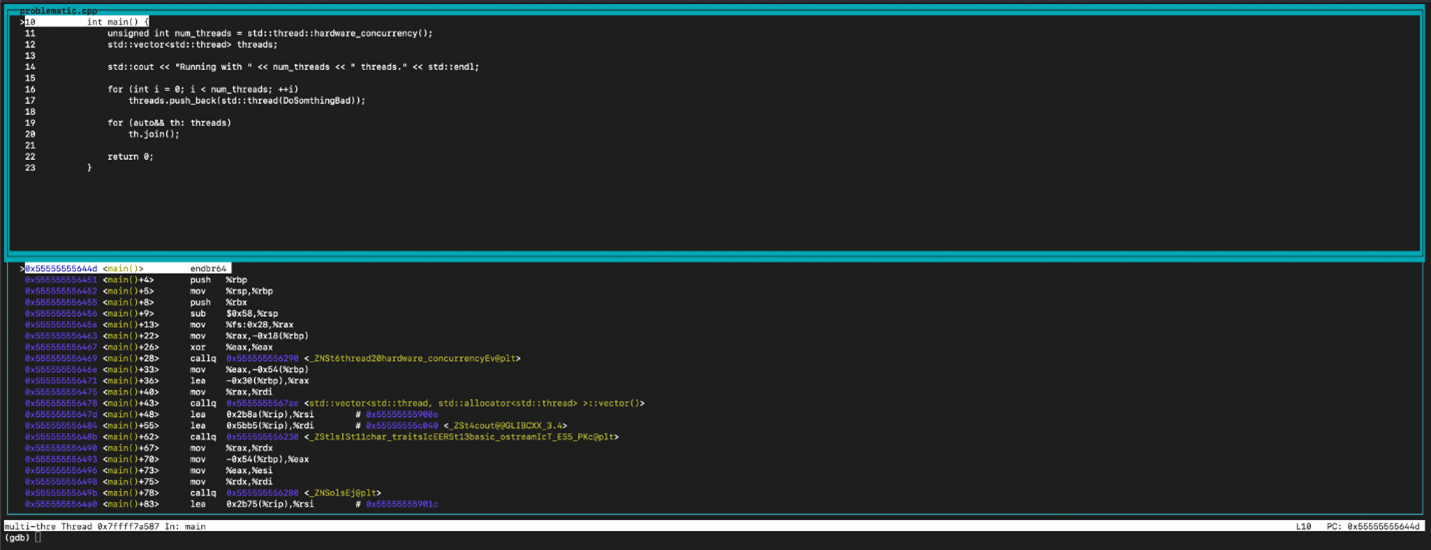
If we don’t know where to place a breakpoint in our code, let’s just use start:
Now let’s place a breakpoint somewhere in our code start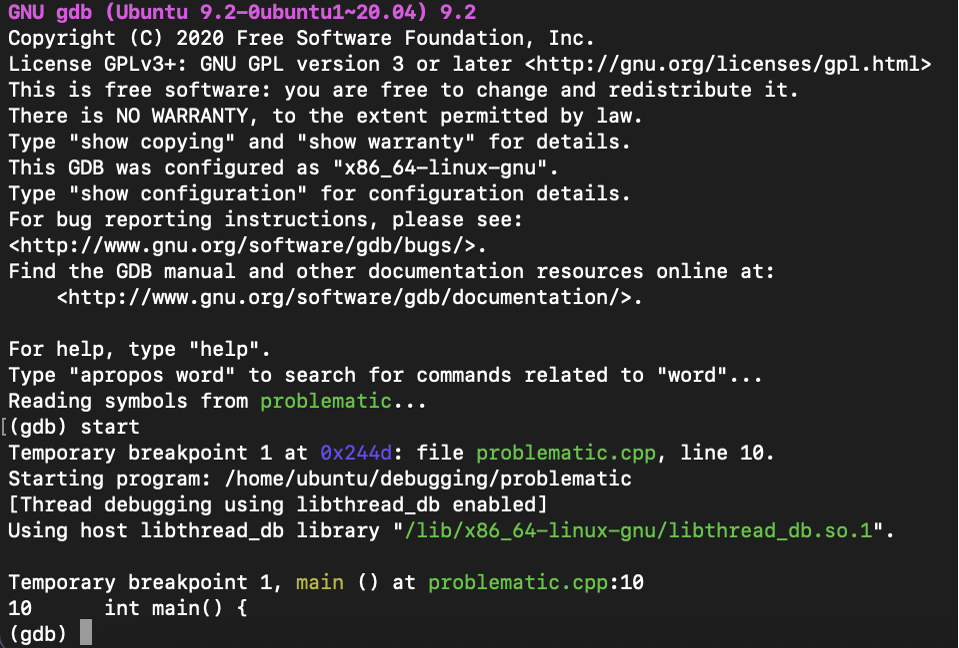
(gdb) start
Temporary breakpoint 3 at 0x140d: file problematic.cpp, line 10.
Starting program: /home/ubuntu/debugging/problematic
[Thread debugging using libthread_db enabled]
Using host libthread_db library "/lib/x86_64-linux-gnu/libthread_db.so.1".


Temporary breakpoint 3, main () at problematic.cpp:10
10     int main() {
(gdb)
Since we haven’t set any breakpoints, GDB will set a breakpoint for us at main (we will show later in this post how to set breakpoints).
Debugging in TUI Mode
Use Ctrl + x then a to enter TUI (Text User Interface) Mode. As we are going to see below, the TUI will enhance our debugging experience and is highly recommended.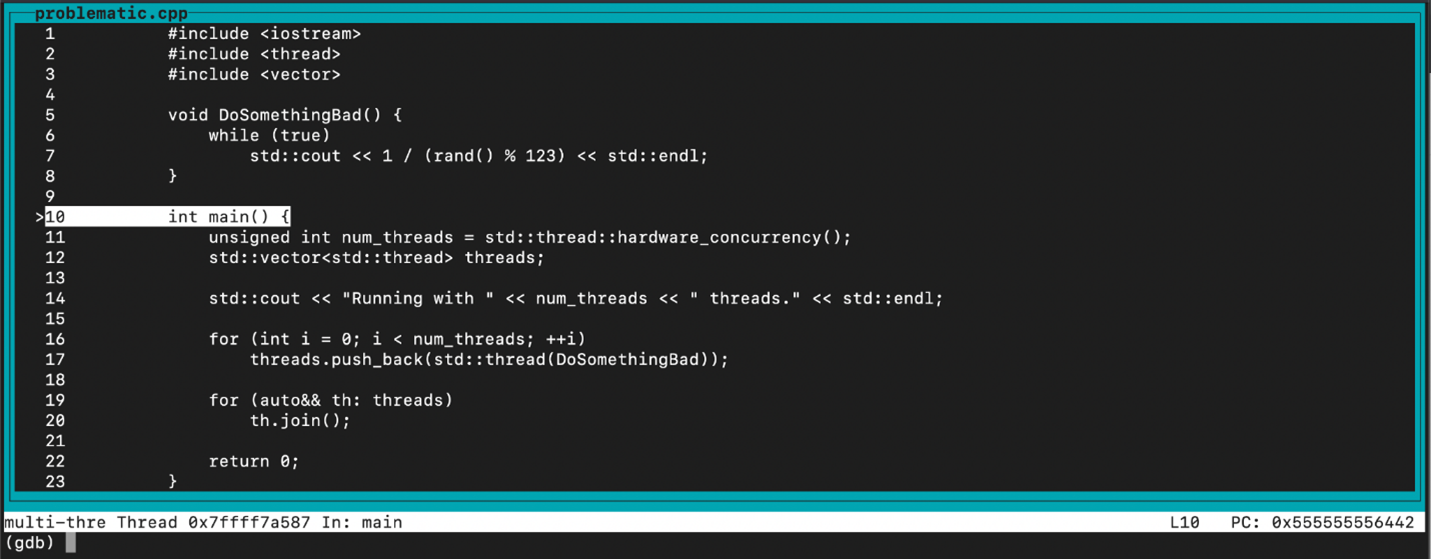
Now we’re talking! TUI is supported on platforms where a suitable version of the curses library is available. You can also launch GDB in TUI mode by running:
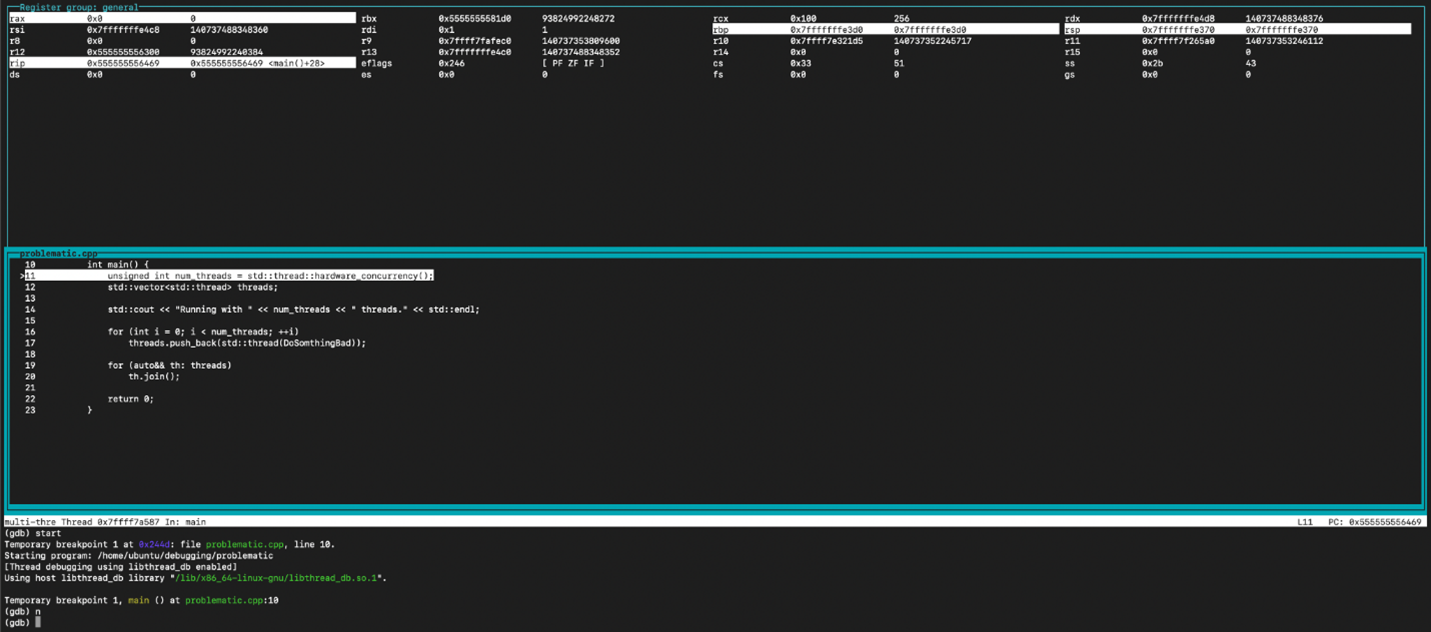
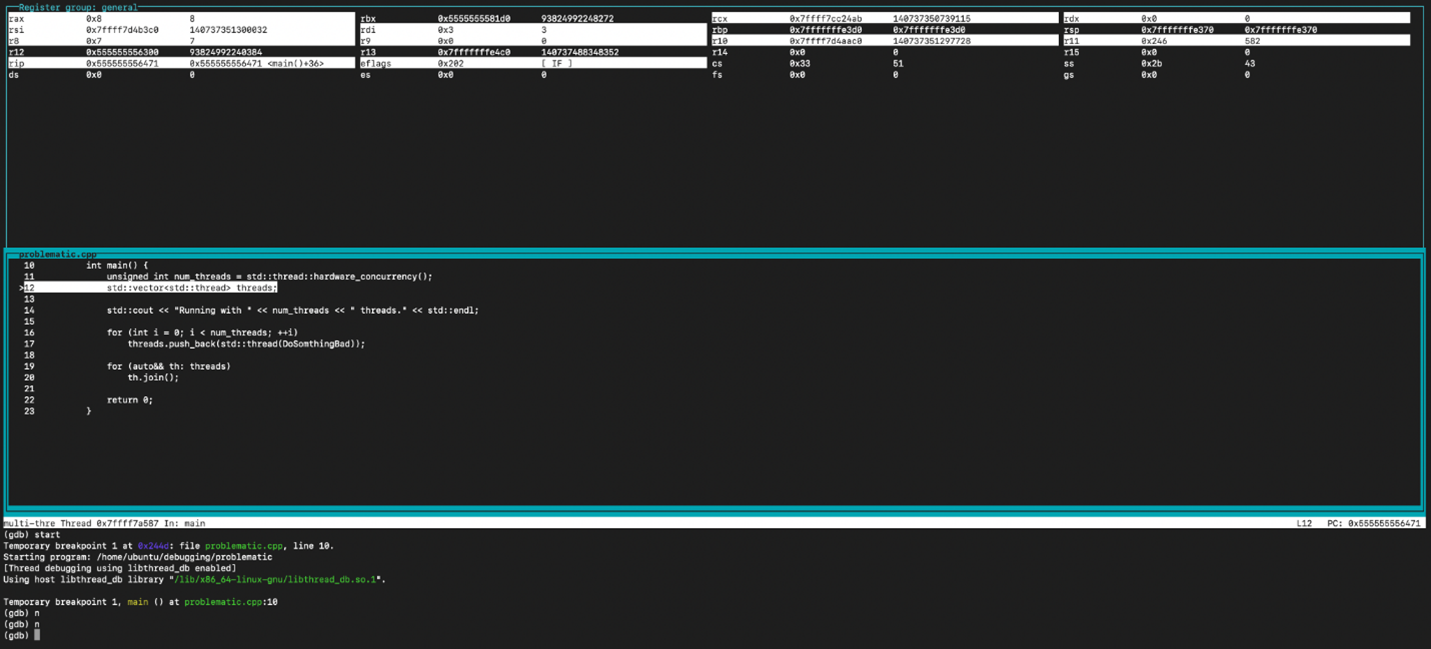
gdb -tui <executable>Now we can use n or next to go to the next line. Let’s execute line-by-line till line 17: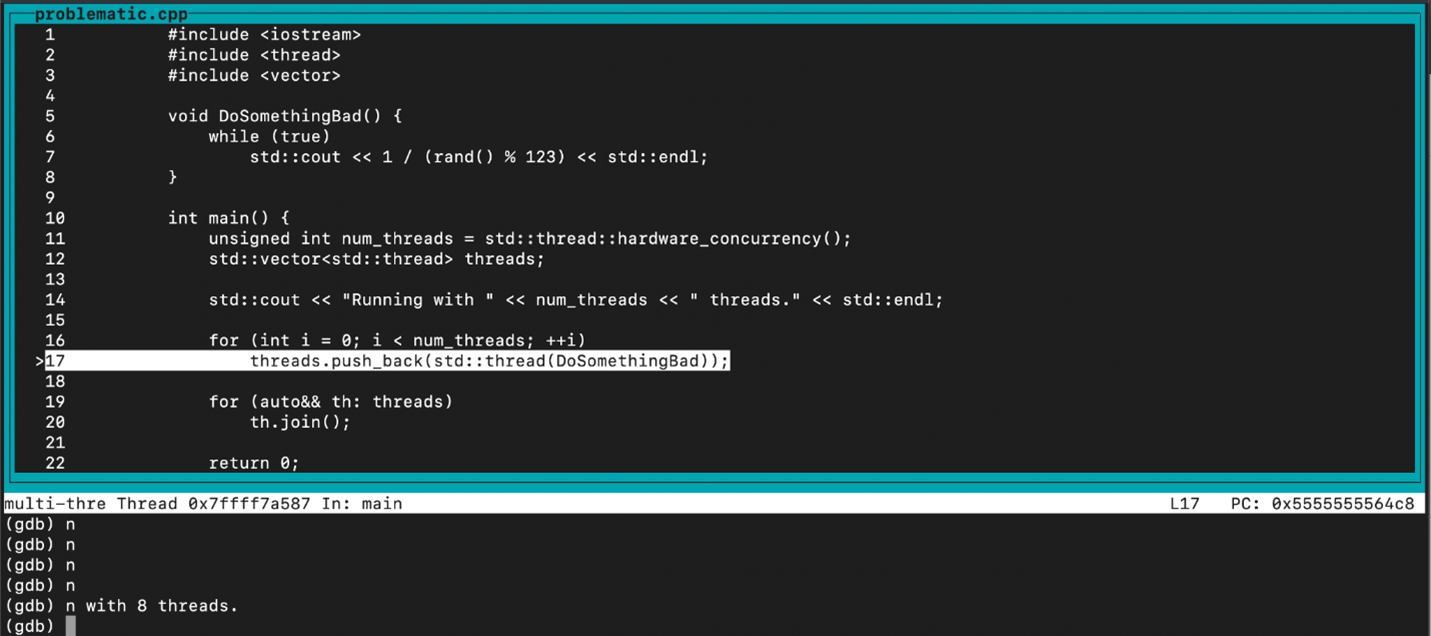
Stepping into a function
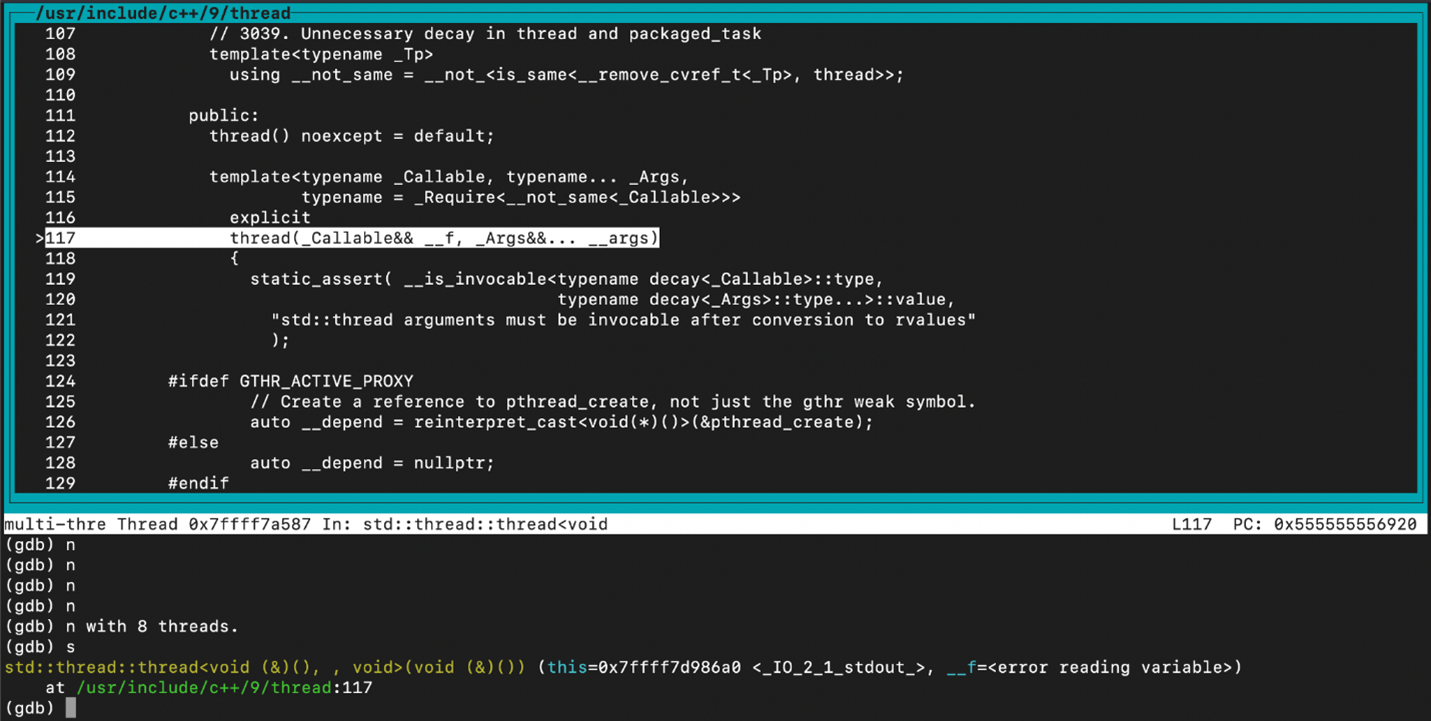
Now let’s step into this thread constructor by simply using s or step, which allows you to step into functions.
Here we go! What a wonderful way to step into the standard library on demand! See how it looks here:
To scroll the code simply use the up and down arrows (or use mouse/touchpad scroll). And what about scrolling command history in this mode? Use Ctrl + p for previous and Ctrl + n for next.
Restarting the program
Let’s start the debugging of our program once again by typing r. This will restart the program while keeping the existing breakpoints, providing us with an opportunity to discuss them.
Setting breakpoints and watchpoints
Let’s set a breakpoint by using b preceded line number, in this example we set a breakpoint at line 14 by typing:
(gdb) b 14
 Observe the b+ indication next to line 14
Now that we have a breakpoint in the future, we can let our program run till the breakpoint by typing c or continue to run it till the next breakpoint. Below we can see line 14 highlighted:
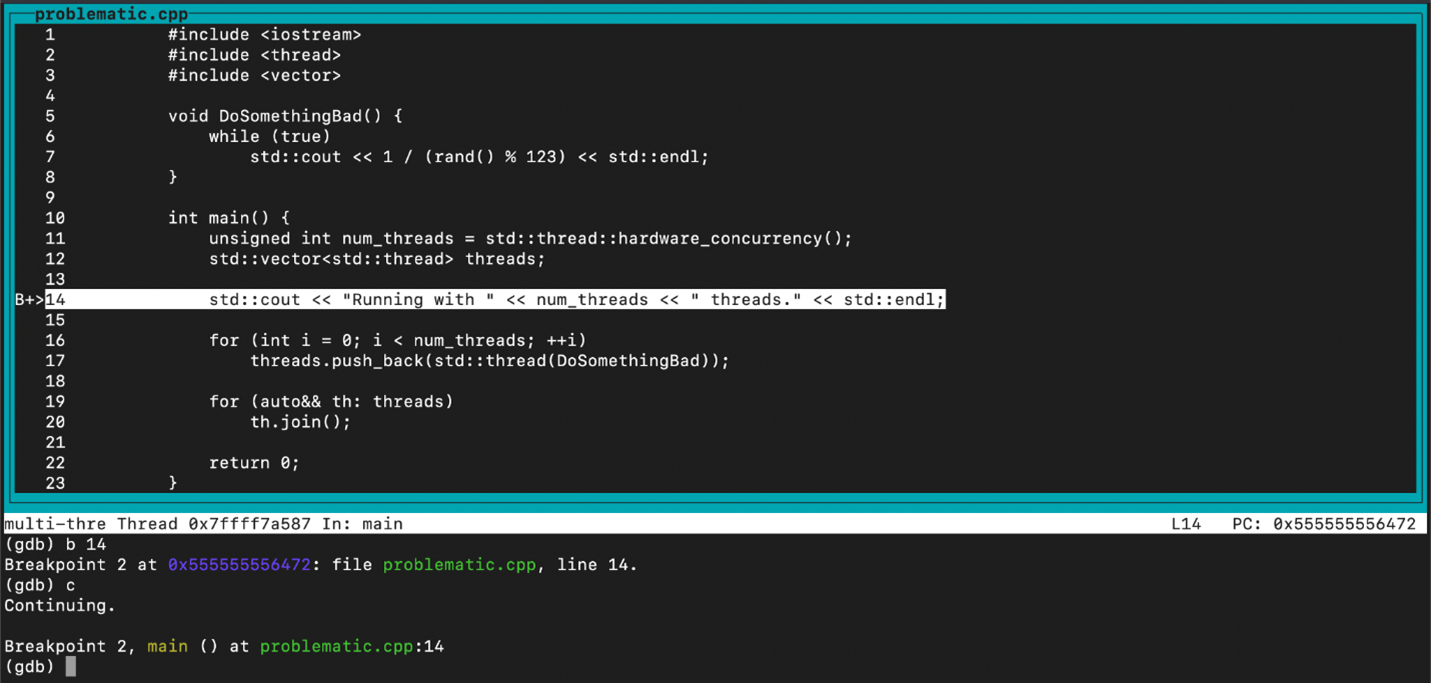
A breakpoint means that we stop at the line before it is executed. Typing n or next will execute the line and our program prints: Running with 8 threads
Another option can be to set a breakpoint at a function, so let’s set a breakpoint at the function DoSomethingBad, with the suspicious name:
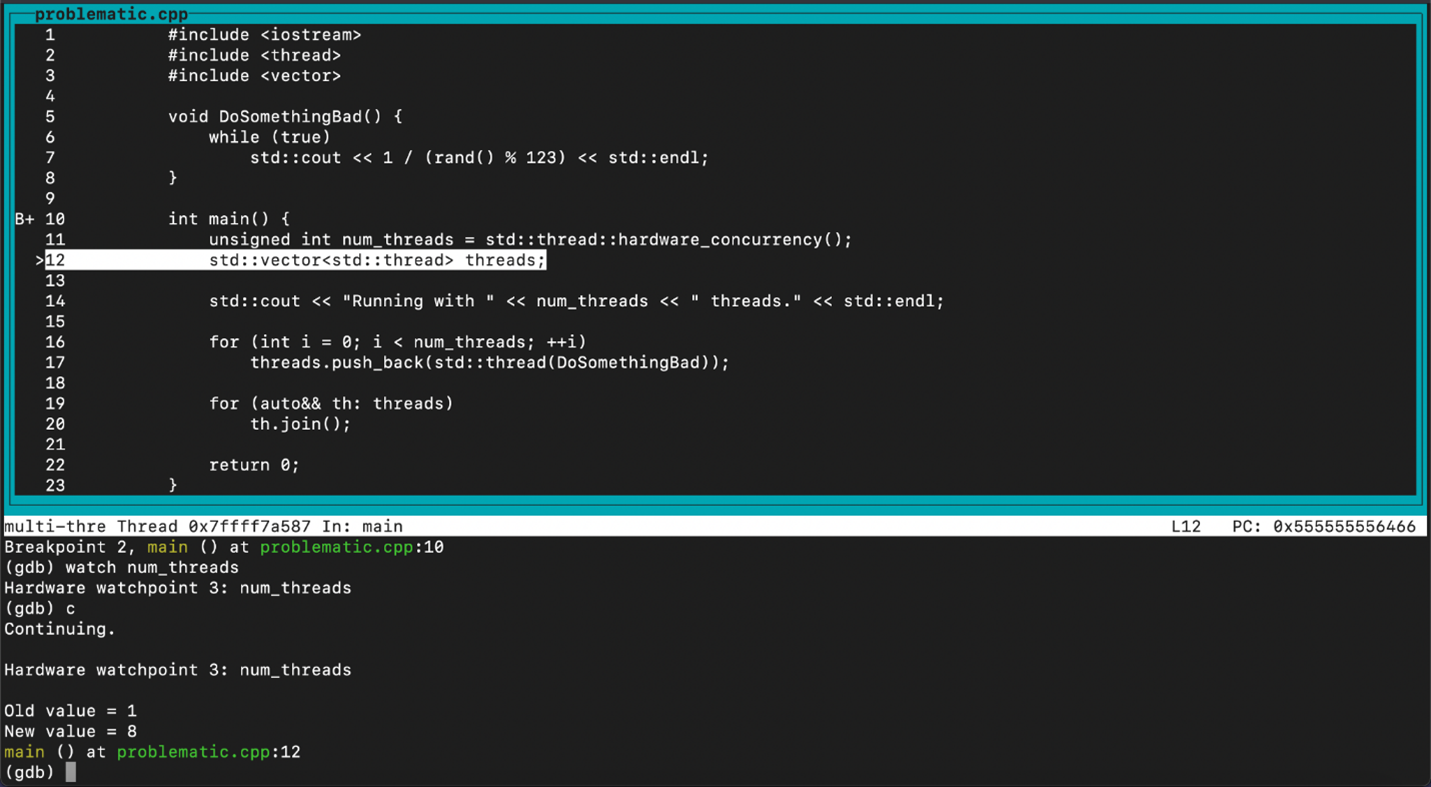
(gdb) b DoSomethingBadThere are times when we can’t predict where a change will happen. We can use watchpoints to tell the debugger to watch an expression and stop the execution when and where such a change occurs. Here’s a simple demonstration for setting a watchpoint:
(gdb) watch num_threads

(gdb) c
See watchpoint aftermath below:
For more options and info about breakpoints and watchpoints see: https://sourceware.org/gdb/current/onlinedocs/gdb/Breakpoints.html
Clearing breakpoints
To clear breakpoints use the clear command:
(gdb) clear <line_number>

(gdb) clear <function_namer>
To delete all breakpoints use d:
(gdb) d

Delete all breakpoints? (y or n) y
For more options see: https://ftp.gnu.org/old-gnu/Manuals/gdb/html_node/gdb_31.html
Cleaning program prints
You may have already noticed that program prints to screen can possibly mess up the display of our debugging session, so to clean prints and repaint the TUI use: Ctrl + l.
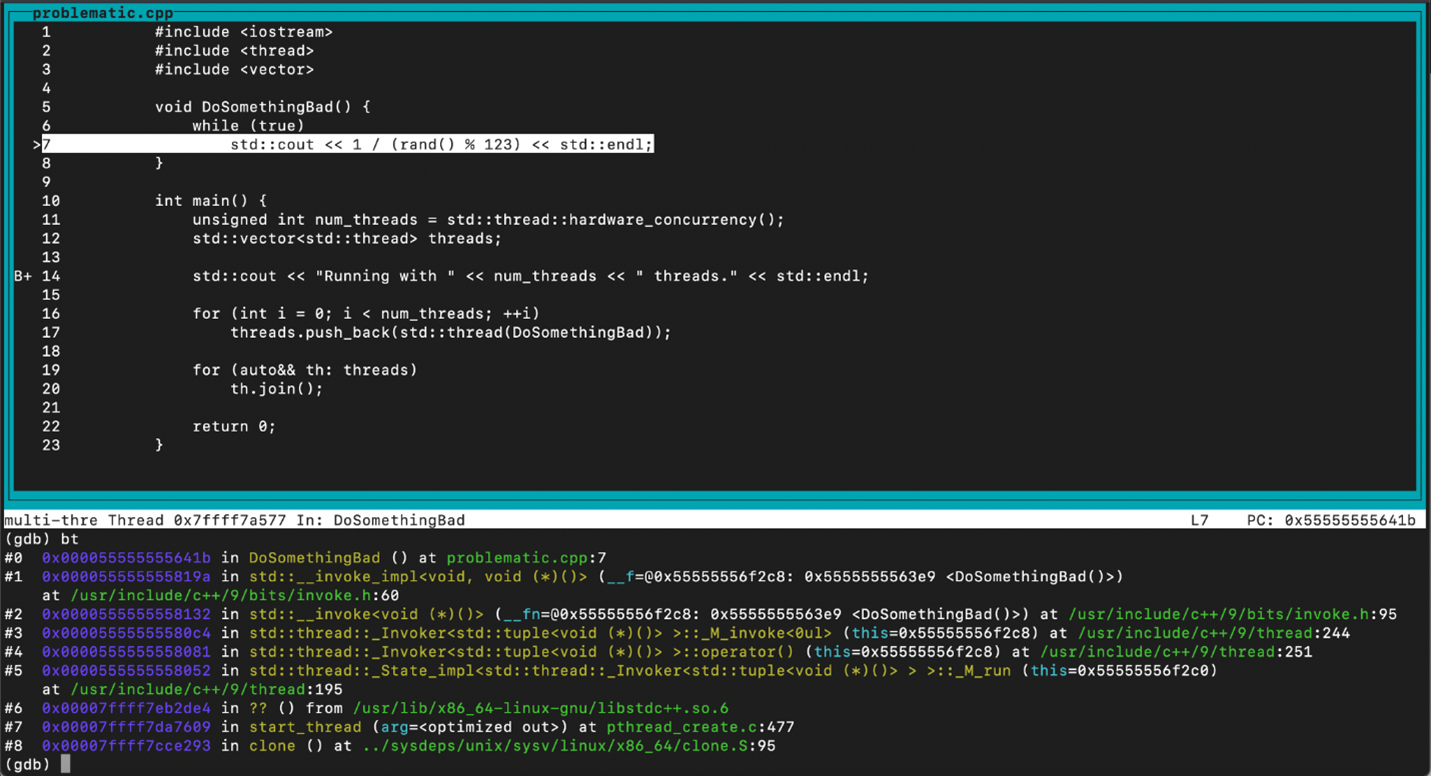
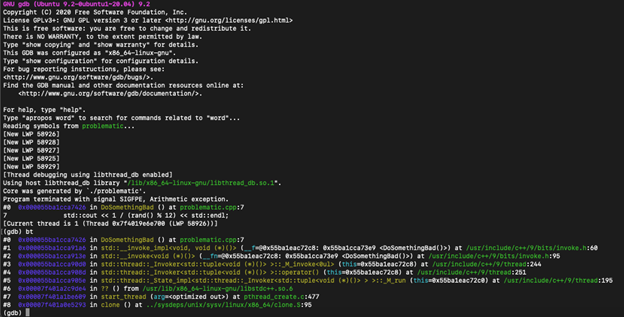
Seeing our program crash
Ok, so let’s just let our program run. We’ll use c or continue to run it till the next breakpoint, but since we have no more breakpoints it will run until it crashes and we get:
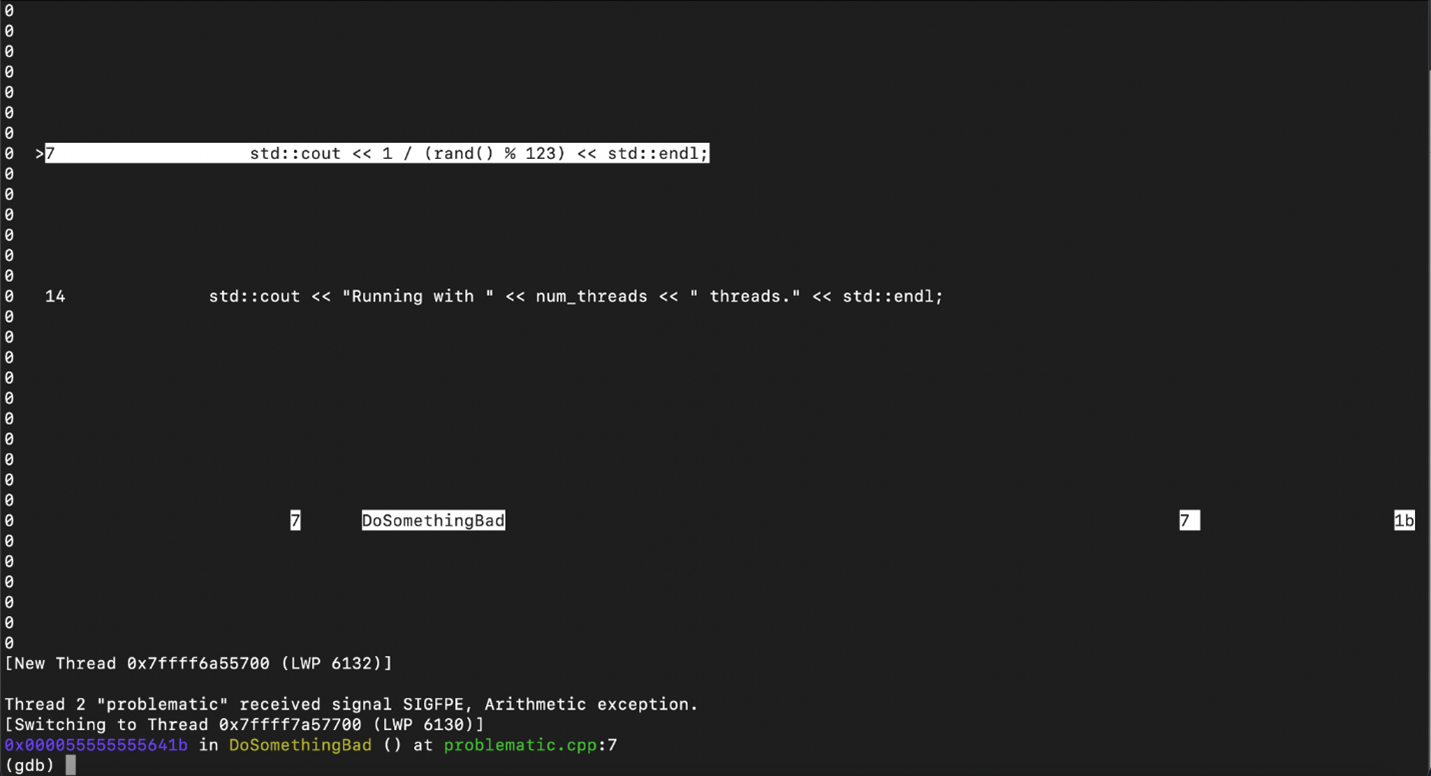
Ok, that’s a lot of prints and it really messed up our debugging experience, but you can use the previously seen prints cleanup and TUI repaint by using Ctrl + l, and now we get a much clearer screen:
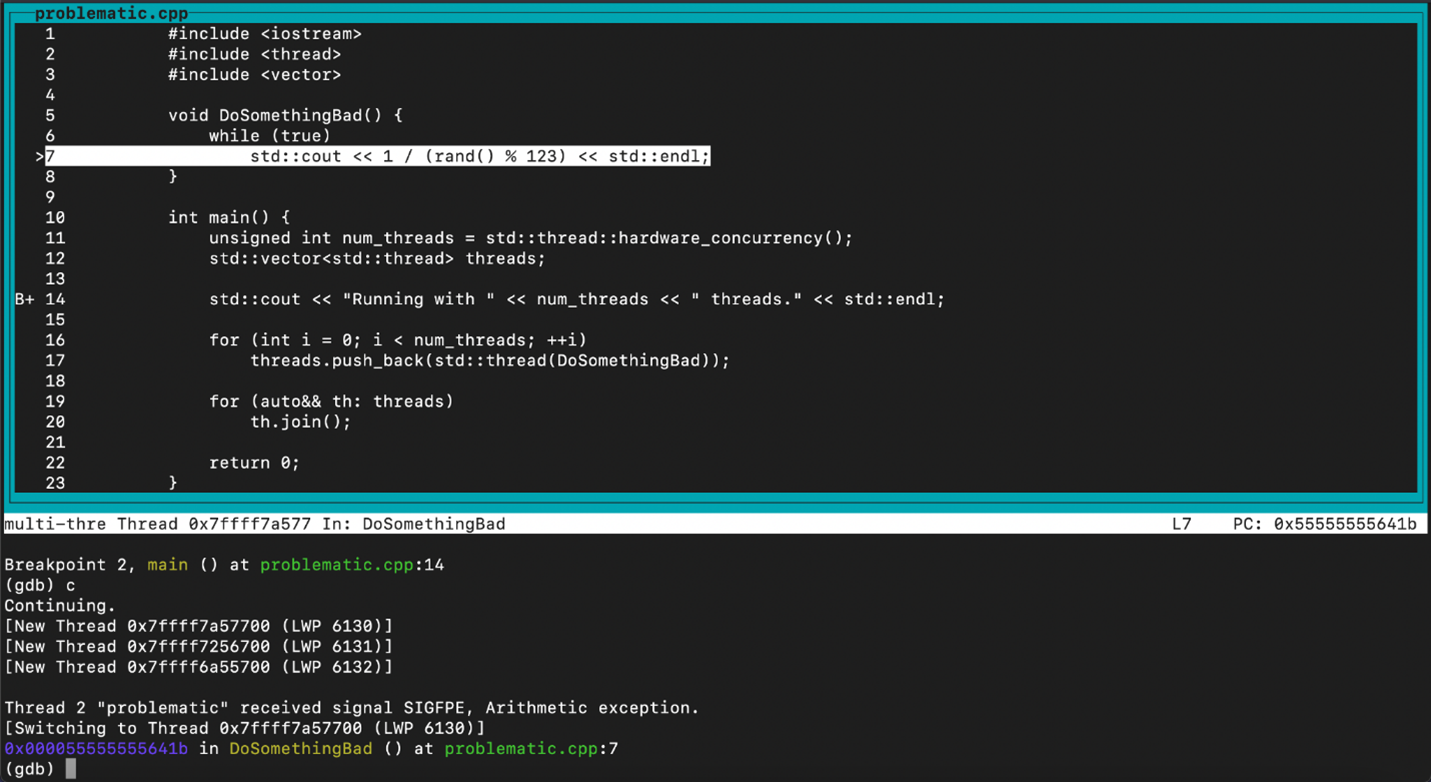
And there we have it, the program crashed at line 7.
Obviously there is a significant probability that the random number is divisible by 12 and therefore we get a division by zero.
In such cases we can use the bt or backtrace command to view stack trace history:
For more backtrace options see: https://sourceware.org/gdb/current/onlinedocs/gdb/Backtrace.html
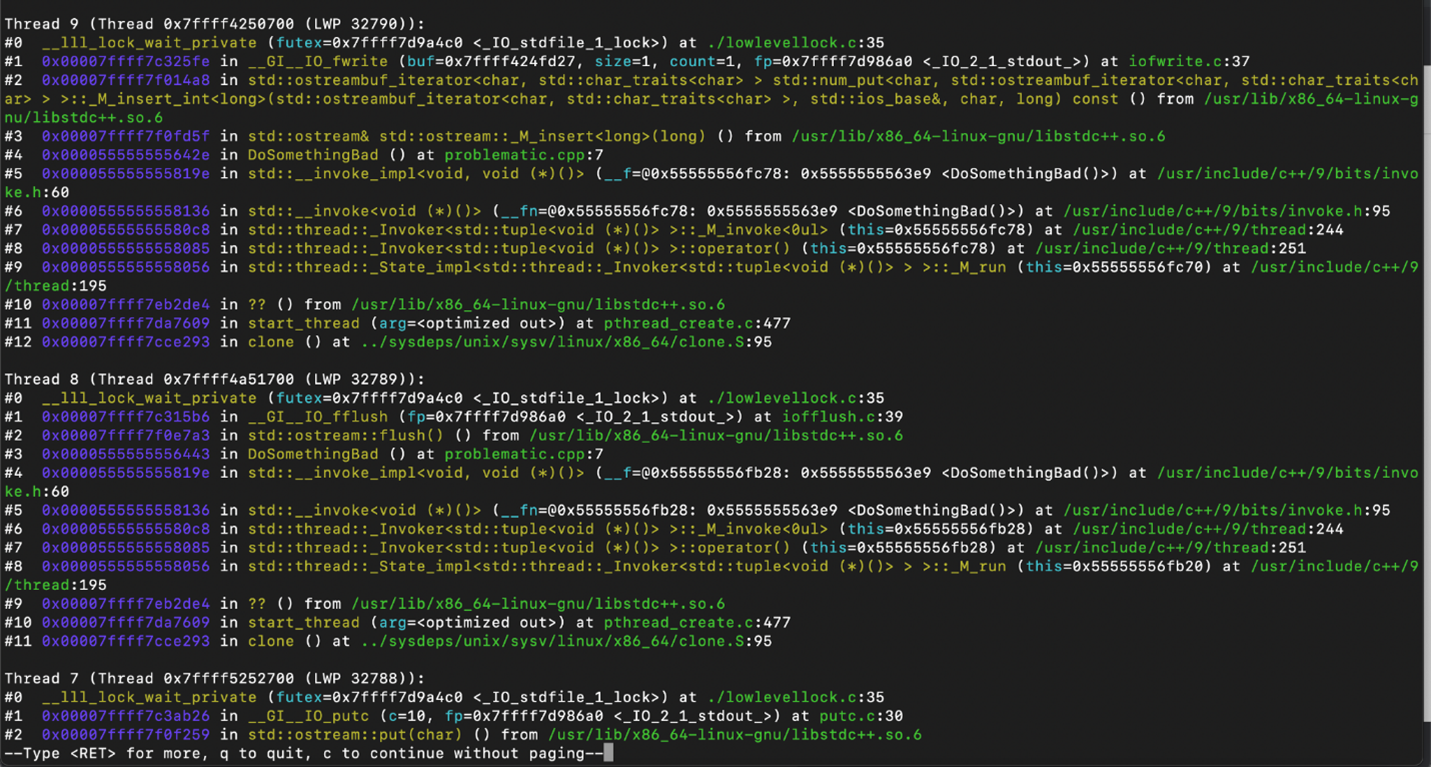
Debugging multiple threads
To view backtrace of all threads, use the thread apply all command followed by bt or backtrace
(gdb) thread apply all bt <bt_options>This will allow you to scroll down threads in a reverse order to the order of their creation. For this run, I picked a significantly higher constant in line 7 to make sure that all additional threads are created before the program crashes:
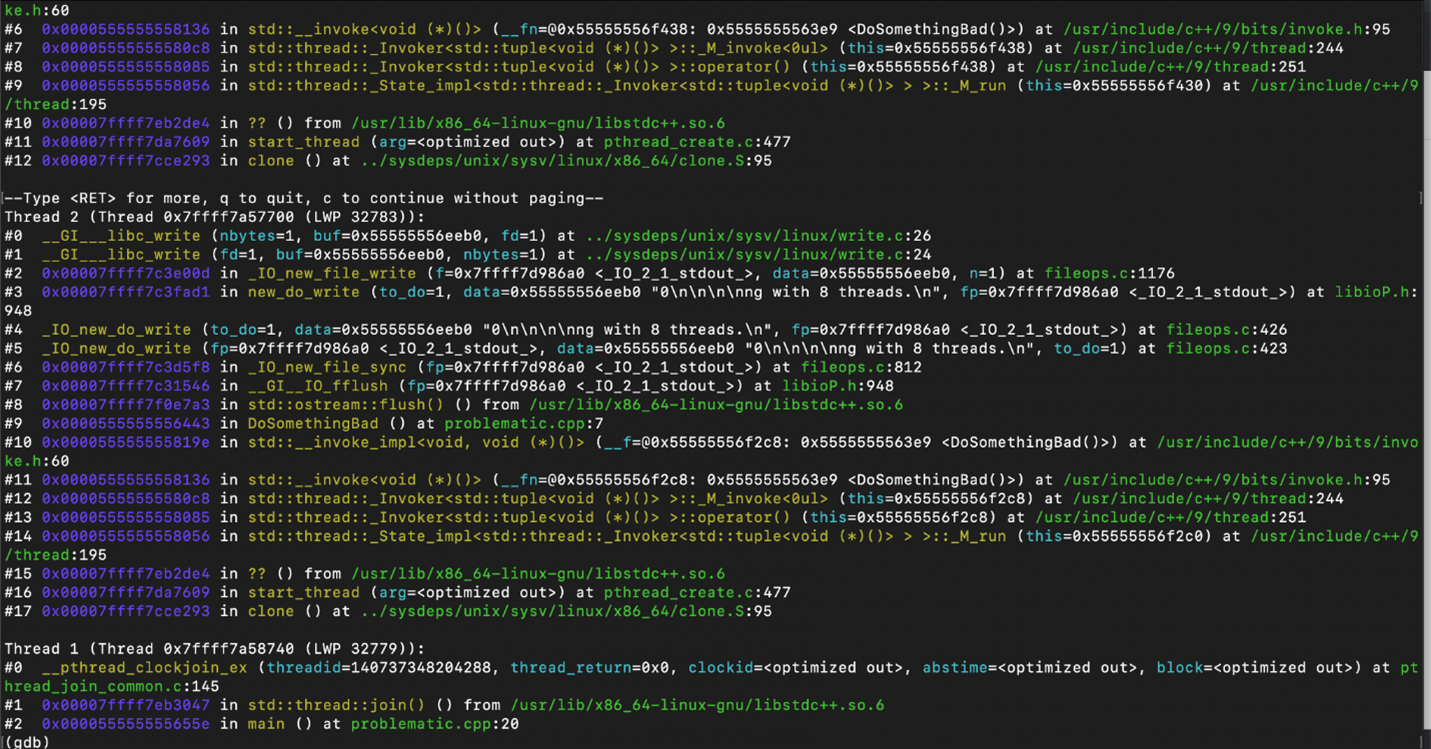
Alternativelty you can use the following command to switch to a specific thread
(gdb) thread <thread_number>Then use any command such as bt to relate to this specific thread.
Printing a variable
At any point, you can print a variable by typing p or print followed by a variable name. In the example below we can see that at the beginning of the run (default breakpoint at beginning of main()) p num_threads would print a value that was stored in it prior to its assignment on line 11 (in this case we get 1), however after line 11 is executed we get the value returned by std::thread::hardware_concurrency():
Printing the stack pointer and its content
(gdb) print $sp
$1 = (void *) 0x7fffffffe370
(gdb) print *(long**) 0x7fffffffe370
$2 = (long *) 0x280
(gdb)
Viewing the Assembly
To view the assembly in TUI Mode, press Ctrl + x then 2 when viewing the source code
Usually you would prefer to debug your code without having to get into the assembly, but in some cases, in order to understand the behavior of a certain run you would find it useful to examine it. For example, if the optimizer eliminated a certain branch from your code, marking it unreachable – maybe because the condition for said branch depended on undefined behavior – you may actually understand the bug you are troubleshooting when you watch the assembly (this is only one of several tools, like compiling with undefined behavior sanitizer flag).
Viewing the registers
To view registers data in TUI Mode, when you are already viewing the two assembly screens (source code screen and assembly screen) in addition to the (gdb) command prompt at the bottom, press Ctrl + x again, then 2. The source code screen will be replaced by the registers’ viewer. To see registers and source code together, press Ctrl + x then 2 one more time. Below note $rax before and after line 11 is executed, and register stored the value of hardware_cuncurancy.
 Before line 11 is executed
 After line 11 is executed
By default the window lists the general purpose registers, but you can switch to another group of registers with this command:
(gdb) tui reg <register_group_name>You can use the following command to view all register groups:
(gbb) maint print reggroupinfo registers, info all-registers, and info registers <register_group_name> would be the gdb command line alternative, outside the TUI mode.
Quit
To quit gdb, simply use q or quit
Core dumps
Another way to analyze a crash is to make sure your environment generates a core dump when the program crashes (usually this requires allowing core files to be larger than a certain value or removing the limit entirely by using: ulimit -c unlimited).
Using the previous example, say our program problematic crashed and generated a core, core. We can use GDB to see where it crashed by running it with both files:
user@mylinux:~/debugging$ gdb problematic coreThen once loaded we can see where the crash happened and use the backtrace command to view the calling trace. See example below:
You can also use the core <core_file> command to load a core file from within a gdb run.
In Windows, we use Userdump.exe to create dump (.dmp) files. The methodology is similar of course.
In many cases following a crash the call stack in the core is going to be corrupted, which is when you would like to use GDB built-in reversible debugging. For a demo of how that works I highly recommend watching Greg Law’s CppCon talk:CppCon 2015: Greg Law ” Give me 15 minutes & I’ll change your view of GDB”:
At 8:44 you will see how to enable stepping backward in time with full context, using reverse-continue command after initiating a record command for the duration of program run.
Summary
We have followed a step-by-step demonstration intended to allow any programmer to debug a code on the terminal window alone, without an IDE. Even if you are experienced with command-line programming, I hope you have learned at least a trick or two that would improve your debugging sessions. I also hope that I have demonstrated how easy it could be to debug in many scenarios without an IDE, a skill you may find useful. For a few more tricks and additional GDB skills I recommend following the resource list below.
References:
- https://sourceware.org/gdb/current/onlinedocs/gdb/
- https://ftp.gnu.org/old-gnu/Manuals/gdb/html_mono/gdb.html
- CppCon 2015: Greg Law ” Give me 15 minutes & I’ll change your view of GDB”
- https://softwareengineering.stackexchange.com/questions/22769/what-programming-language-generates-fewest-hard-to-find-bugs
- https://cs.brown.edu/courses/cs033/docs/guides/gdb.pdf