There it is, in black and white
Seconds matter. In today’s software industry, the ability to deliver software, updates, fixes, and new apps faster is critical to success. And yet, developers still face some of the same roadblocks and bottlenecks they’ve always had.
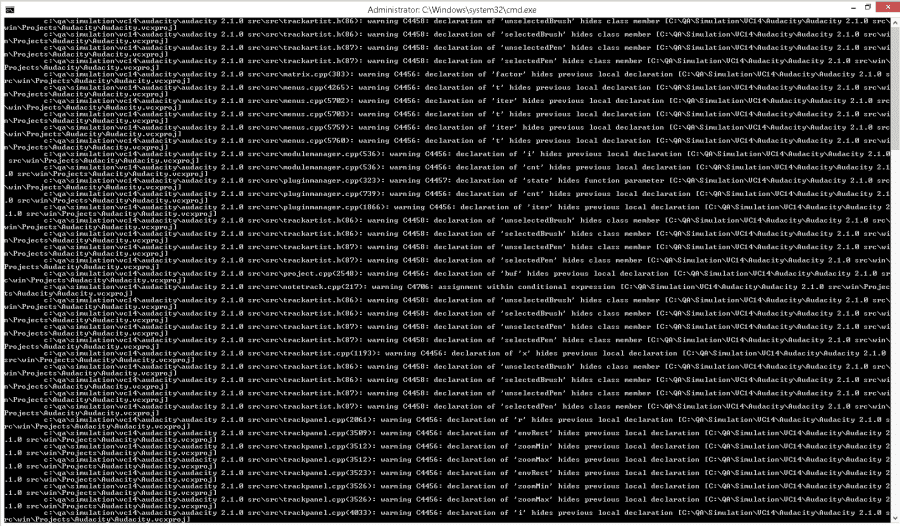
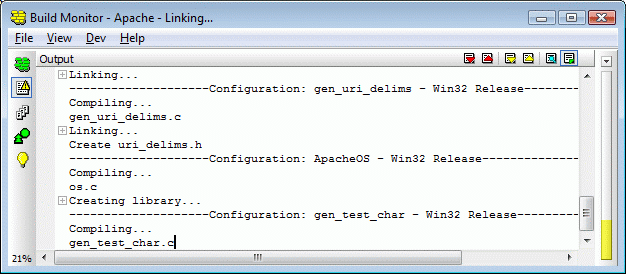
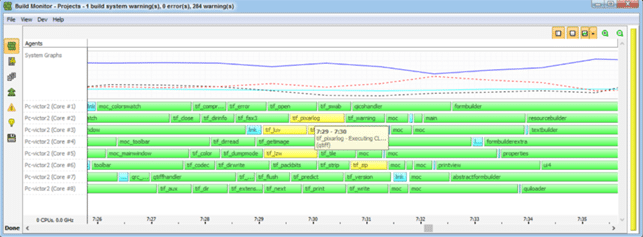
For instance, builds remain a black box that’s tough to crack. When your builds look like this:
Finding areas for improvement is like diving for needles in haystacks. You can use virtualized parallel distribution and build caching to shorten your builds, and these tools can significantly reduce your compile times. But how well do you know your builds on a granular level?
For most build engineers, visibility happens before the build, or once the build fails. Being able find errors, bottlenecks, and dependencies in our software builds is priceless.
Let’s dive a little deeper.
Your builds, live and in color
“Being able to directly visually audit the build process to look for bottlenecks whilst reducing execution time is wonderful.” -Richard Trotter
The Incredibuild Build Monitor replaces your old text output with an intuitive graphic UI where you can easily identify and investigate at a granular level things like dependencies and bottlenecks and other ways to better optimize your code structure and build.
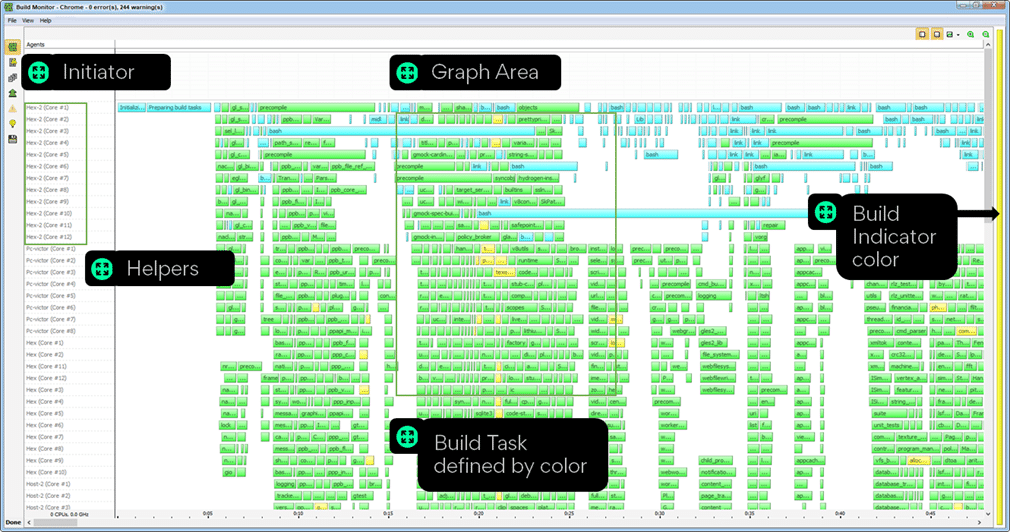
These are the main components of the build monitor:
| Component | Description |
| Agent list (Y axis) | All the CPU logical cores that make up your Incredibuild compute Grid are listed on the left pane of the Build Monitor. The logical cores participating in the build are called Agents. The first set of Agents in the list are always the initiating machine, or Initiator. The remaining machines are the Helpers.
|
| Progress
(X axis) |
Systems graph shows the timeline |
| Bars | These are the compiler/linker instances or compiler/linker processes |
| Graph Area | Holds perhaps the most important key for build analysis and optimization. It holds info about the Initiator machine such as CPU, Memory, Network and regarding the distribution potential at any point of the build.
|
| Task colors | The tasks color provides a better understanding of the build flow and acceleration potential:
Purple: A currently running task. Cyan: A locally running task (custom build steps, link operations, or creation of browse information) that terminated successfully. Green: A distributable task that can run locally or on remote machines, (for example, compilation in Visual Studio, cl.exe), which terminated successfully. Yellow: Files that generated build warning which is usually normal and has no effect on the build Red: Files that failed to build White: A task was canceled or moved to a different helper. |
Let’s dive into a clearer example of what’s going on in the build monitor:
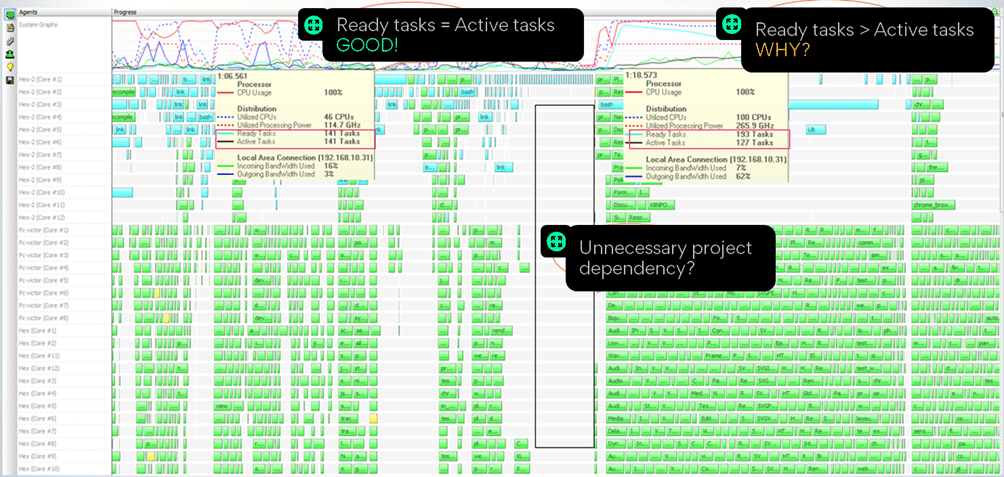
We can see a big “gap” in which in both sides of it, you see only green bars and during this gap only blue tasks are executed. Such behavior is usually made by dependency. It obviously doesn’t mean that there is a problem but since it was so easy to detect, perhaps it’s worthwhile to investigate whether this dependency is needed.
Another example is the graph area indicators – “Ready Tasks” and “Active Tasks”. When they are close to each other or equal – like in the sample in the left – the build is fully utilized and there is no further acceleration potential. However, on the right, we can see that the “Ready Tasks” is higher than the actual “Active Tasks”. To further optimize your build, you can simply add more resources.
Turn back time and replay your builds
Rewind a recording of your build and see how it performed and how things transpired. Share your build execution so that other team members can replay it too and further analyze its results:
Switch between different display types
The Build Monitor enables you to view your build progress and output through four different display types. Switch between displays to get the full picture about your build in the most convenient way for you:
Progress Display
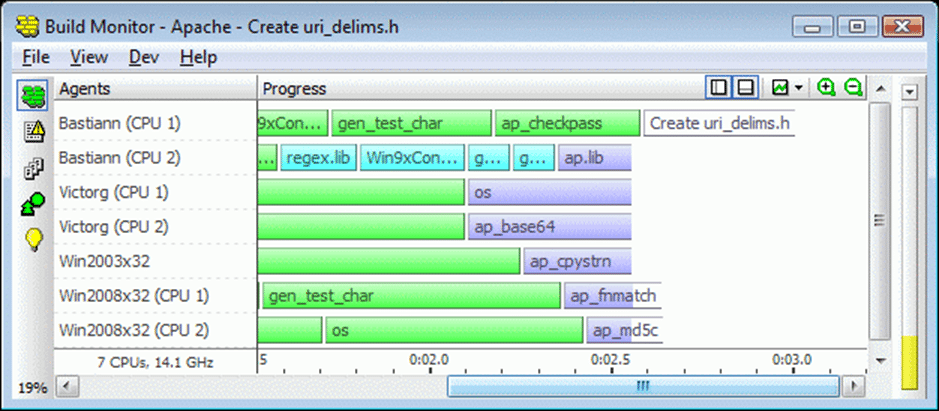
Build files transform into colorful bars. Each color represents the status of the relevant file, so you can see which files were built without a problem and which weren’t:
Output Display
See the entire build’s output text, similar to what would have been generated by Microsoft Visual Studio builds:
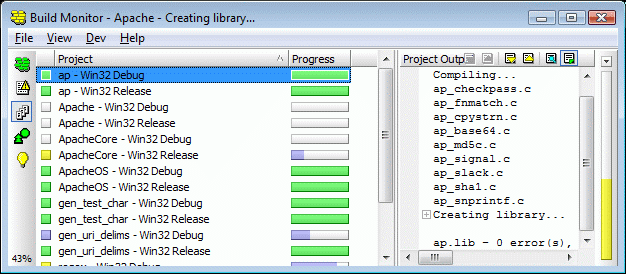
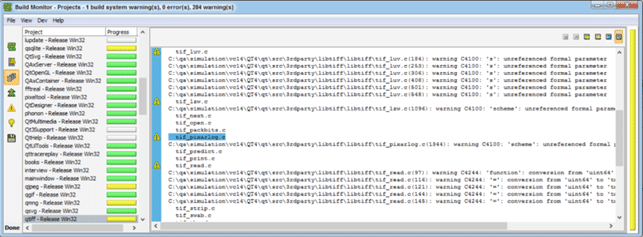
Projects Display
Clearly distinguish between each project’s text-based output messages, including warning and error messages:
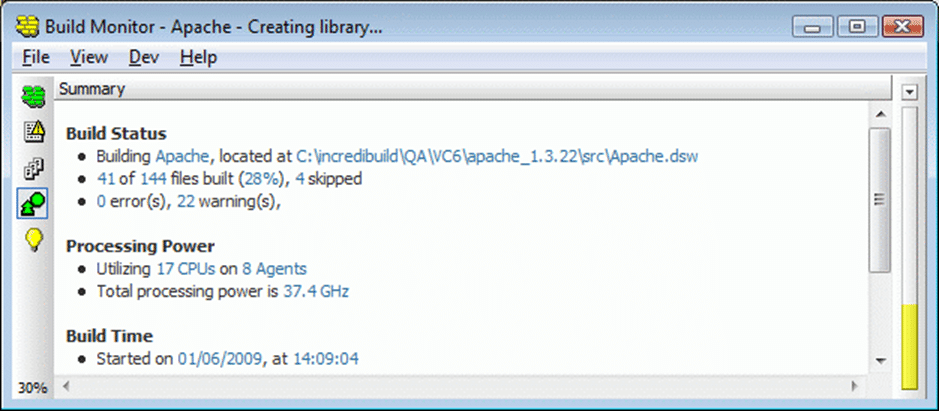
Summing it all up
Get a high-level overview with all the information and statistics on the current build in one place:
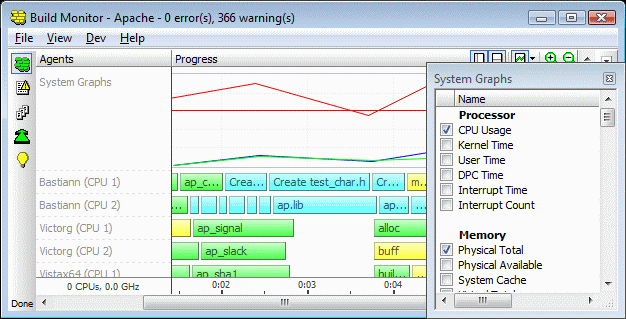
Customize your own build graph
Choose the parameters you care about and turn them into a visual graph. Keep visual track of more than a dozen of relevant KPI, such as CPU Usage, tasks ready to be executed, memory usage, I/O, and many more:
A unified way to gather execution data
It doesn’t matter what type of execution you’re running on which platform. The Build Monitor provides a unified way to gather and compare data regardless of where it originates from. Hover over a bar to see the task’s command line:
Double-clicking the task will take you directly to the relevant textual output:
Start visualizing your builds in a whole new way and accelerate your development with Incredibuild today.

